

Meteor Radar Observations
The Canadian Meteor Orbit Radar (CMOR)
Daily Operations
CMOR is a highly automated radar. Each day, automatically generated state of health data, plots and initial data summaries are produced and emailed to users. This high fidelity reporting capability allows CMOR to stay on the air with a duty cycle in excess of 95%. An example of the daily output summaries from CMOR is shown below for the 2009 Geminid shower peak:
Daily sporadic and shower fluxes and equivalent daily averaged ZHRs are computed
freq 29.850 MHz
solarlon 260.46 deg
sporadic 1.35e+00 1/km^2/hr (meteoroid mass > 1.1e-07 kg)
shower GEM 5.52e-02 1/km^2/hr (meteoroid mass > 1.8e-07 kg)
8.57e-02 1/km^2/hr (meteoroid mass > 1.1e-07 kg, using s = 2.0)
ZHR GEM 95.0
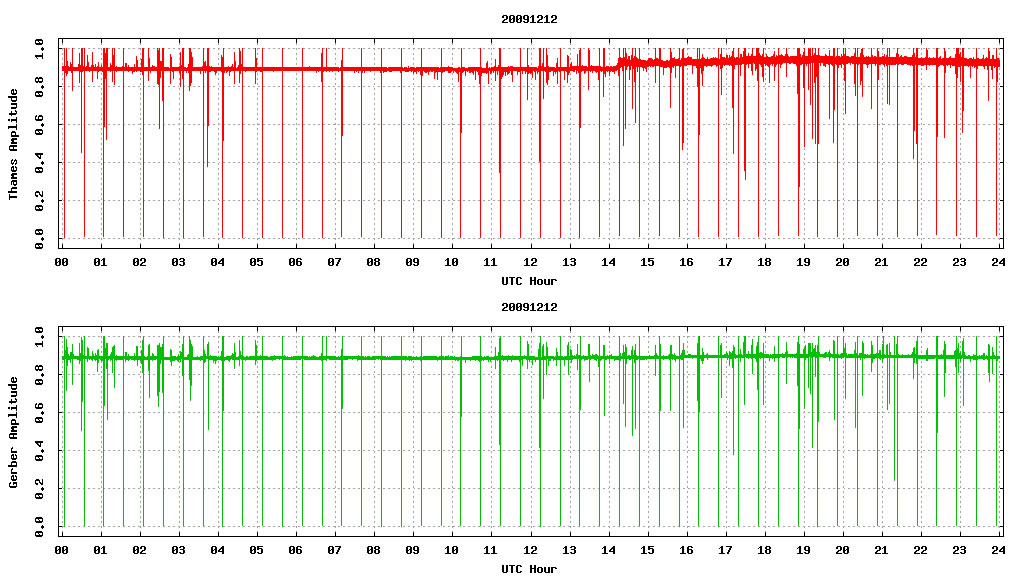
Additionally, the numbers of measured orbits per hour and the strength of the remote station UHF links are computed and link strength is displayed graphically:
UTC count Zehr Thames Gerber Thames-Zehr Gerber-Zehr
--------------------------------------------------------------------
all 5163 41.6 dB 30.3 dB 30.7 dB -11.2 dB -10.9 dB
0 88 42.4 dB 29.4 dB 32.1 dB -13.0 dB -10.3 dB
1 137 42.6 dB 30.1 dB 31.8 dB -12.5 dB -10.8 dB
2 166 43.6 dB 31.0 dB 32.1 dB -12.5 dB -11.5 dB
3 212 43.2 dB 30.7 dB 32.0 dB -12.5 dB -11.1 dB
4 267 42.7 dB 30.7 dB 31.3 dB -12.1 dB -11.4 dB
5 268 40.5 dB 29.2 dB 29.1 dB -11.3 dB -11.4 dB
6 162 40.7 dB 29.2 dB 30.2 dB -11.4 dB -10.5 dB
7 227 41.0 dB 29.4 dB 29.4 dB -11.6 dB -11.6 dB
8 293 41.3 dB 29.9 dB 29.5 dB -11.4 dB -11.7 dB
9 455 41.1 dB 30.6 dB 30.0 dB -10.5 dB -11.1 dB
10 474 41.2 dB 30.7 dB 30.9 dB -10.5 dB -10.3 dB
11 431 41.7 dB 30.8 dB 31.1 dB -10.8 dB -10.6 dB
12 418 41.7 dB 30.4 dB 30.9 dB -11.3 dB -10.8 dB
13 350 42.4 dB 30.9 dB 31.8 dB -11.5 dB -10.6 dB
14 287 41.5 dB 30.8 dB 31.1 dB -10.8 dB -10.5 dB
15 219 41.3 dB 29.9 dB 30.5 dB -11.4 dB -10.8 dB
16 155 41.1 dB 30.9 dB 30.8 dB -10.3 dB -10.3 dB
17 131 40.2 dB 30.4 dB 29.6 dB -9.8 dB -10.6 dB
18 109 40.2 dB 30.2 dB 29.7 dB -10.0 dB -10.5 dB
19 86 40.9 dB 30.4 dB 30.6 dB -10.5 dB -10.3 dB
20 75 40.9 dB 29.5 dB 29.7 dB -11.3 dB -11.2 dB
21 37 39.1 dB 28.1 dB 28.2 dB -11.0 dB -10.9 dB
22 46 43.0 dB 30.5 dB 32.6 dB -12.5 dB -10.4 dB
23 70 40.9 dB 30.0 dB 31.7 dB -10.9 dB -9.3 dB
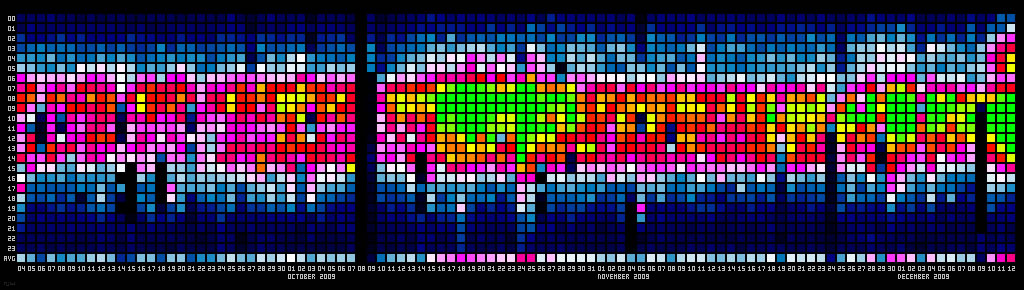
The total number of recorded echoes per hourly bin over the previous two months is constantly updated in graphical form:
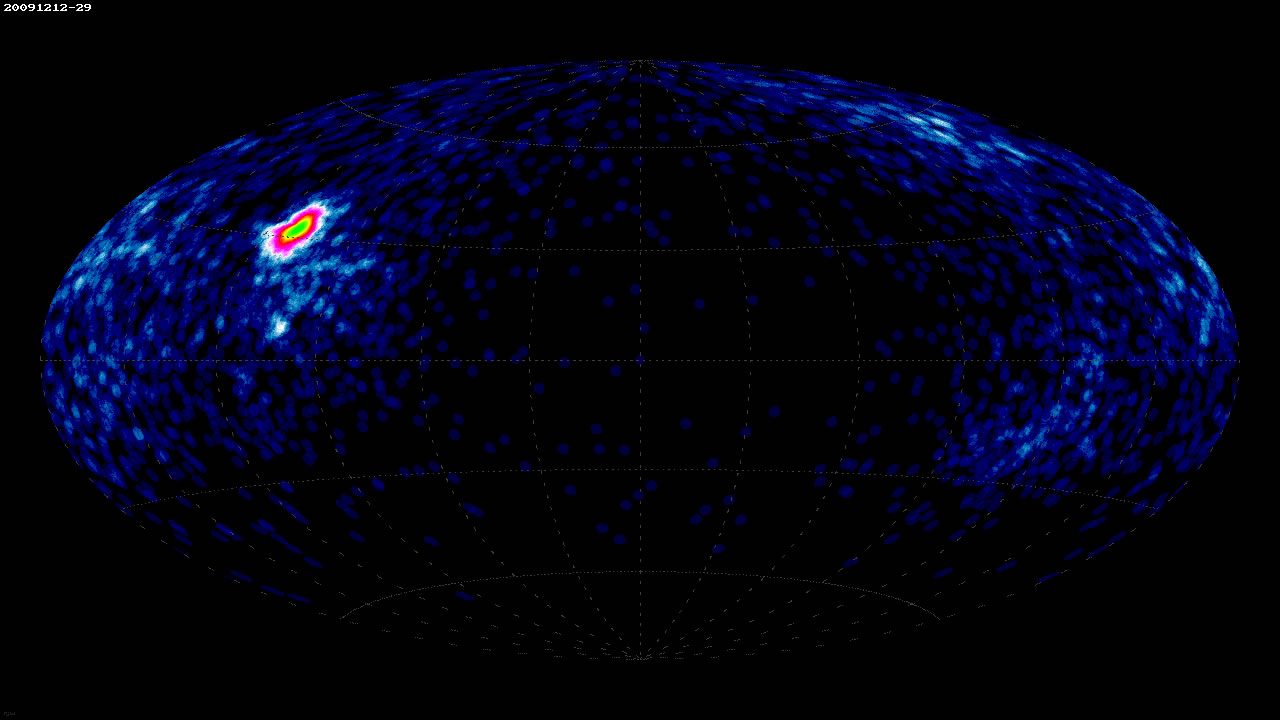
Radiant plots in equatorial coordinates of each days activity are also shown: